Empower Your IBM ELM Infrastructure for Optimal Efficiency
In today's fast-paced business world, efficient IT administration is crucial. Softacus simplifies IT management, focusing on IBM Engineering Lifecycle Management (ELM) and infrastructure. We ensure seamless operations, prevent issues, and provide valuable insights for enhanced business performance.
Your Trusted IT Partner
Our advanced IBM ELM application monitoring enhances efficiency in today's vast digital landscape. We proactively manage any potential issues, ensuring your IT systems run smoothly. Softacus serves as your vigilant guardian, anticipating and preventing problems, before they arise, ensuring a trouble-free operational experience. safeguarding your operations and revenue. Our custom monitoring solution helps you proactively mitigate problems while enhancing your system's efficiency and resilience.
At Softacus, we're not just a service provider; we're your partners in success. We provide more than just monitoring, we promise a more efficient, streamlined, and forward-thinking IT environment. With our experience in IBM solutions, we ensure that your applications operate at their peak potential, allowing you to focus on what truly matters - your business objectives.

1.) Computer Network
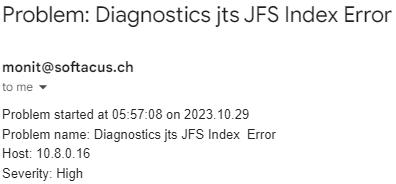
Imagine that one morning, you get an email from your monitoring system about an issue with IBM ELM (Jazz) on a specific computer, even marked as high-priority.
Following image represents the email you got from the monitoring system.
2.) Monitoring problem
When you check the monitoring website, you indeed see the problem.
Following image represents a problem on a monitoring website.
3.) Monitoring problem visualized
You call your tech expert, who knows exactly where to find the issue and how to fix it. This prevents a situation where you'd have to call in a technician and struggle to figure out the problem. Without monitoring, you wouldn't know which server had an issue, what the problem was, and it might have gone unnoticed for a long time, causing more complications.
Custom Monitoring Solution
Explore Softacus's tailored monitoring solution, powered by Zabbix and Grafana. From fundamental system parameters to specific application details, we've got your IT covered. Our goal isn't just monitoring, it's to build a more efficient, future-ready IT environment that redefines excellence in your business. Unveil the core of our solution, where Zabbix gathers essential data and Grafana visualizes it, making your insights easily accessible.
The following picture shows the architecture of the monitoring solution, where the building block is the Zabbix server, which acquires data by itself or by using Zabbix agents. Grafana is used for data visualization using the Zabbix plugin.
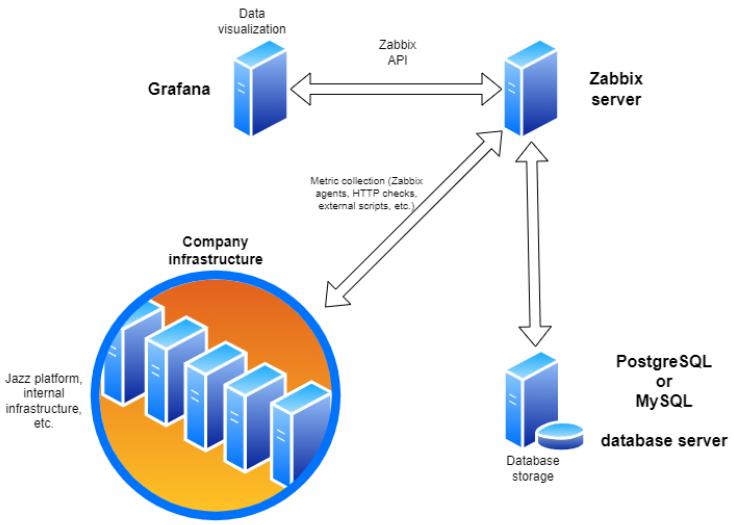
4.) Architecture of the monitoring solution
Complete Monitoring Metrics and Data Visualization
Comprehensive Monitoring Metrics
We've got a comprehensive set of metrics, covering everything from basic system parameters to the intricate aspects of the IBM Jazz platform, ensuring you're well-prepared for any deviations from the norm. Grafana is here to make data visualization a breeze, providing you with tailored, real-time insights and interactive dashboards for quick, informed decisions. With Softacus, you're ready to optimize your IBM ELM infrastructure for maximum efficiency.
Does your system occasionally have issues or runs slowly? Without monitoring, you'd have to go through each server and check how they're doing. This takes time, especially if you're using IBM ELM and need to inspect the Java Virtual Machine. Monitoring is a time and money saver because it quickly shows you where the problem is and whether everything's set up correctly.
Following image represents monitoring of space and CPU utilization for physical servers or VMs and for JVMs. For this image a Zabbix tool was used.

10.) Performance Dashboard Graphs
Grafana plays a pivotal role in enhancing our monitoring solution, creating user-friendly custom visualizations to meet specific needs. Real-time insights and interactive dashboards present technical data in an easy-to-understand way empowering users to analyze and understand the system's health, facilitating quick and informed decisions.
Monitor your space, CPU, RAM utilization, servers availability, and backups. With Grafana, you can spot any problem instantly.
In the following example “OK”, that means it is working and everything is good, if there is “FAILED” that means that server is not accessible and if there is “Warning” that means that the metrics are on limit values but it is still informative.

6.) Grafana Monitoring Dashboard
The following image represents monitoring of the specific IBM ELM environment. In the upper part there is server utilization monitoring (space, CPU and RAM). In the lower part there are metrics from IBM ELM (Jazz), where you can find registered applications (left side) and license usage monitoring (right side). “FAILED” for registered applications means that the application is not registered, “OK” means that the application is registered and is working. “Assigned” for license monitoring means that license is used and there are still free licenses, “No assigned” means that you don’t have free licenses or you don’t use these licenses.
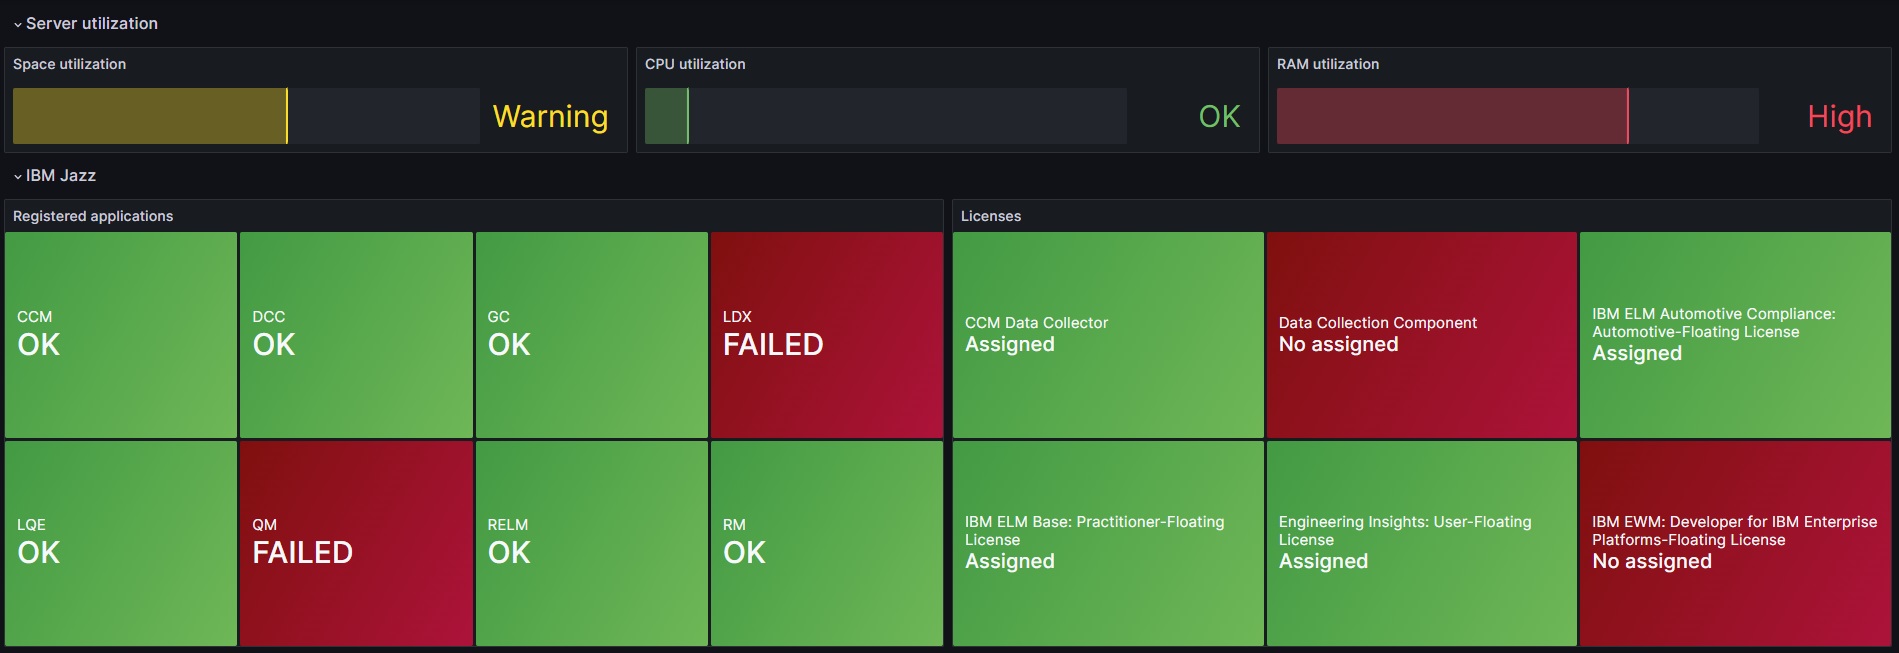
7.) IBM ELM Environment Monitoring
The image below represents monitoring metrics from IBM ELM (Jazz) diagnostics. You can see “Failed” statements on some applications, which means that the application has a problem with some part of the system (such as database, service or JVM). On the other hand, “OK” or “Working” represents that everything is good and it is working well (for each application).

8.) IBM ELM Jazz Diagnostics
Do you need the status and expiration of your SSL certificates? Our solution provides you insights in a simple, easy to understand way.
The following image represents monitoring of SSL certificates (days to expire) for some web applications or web pages
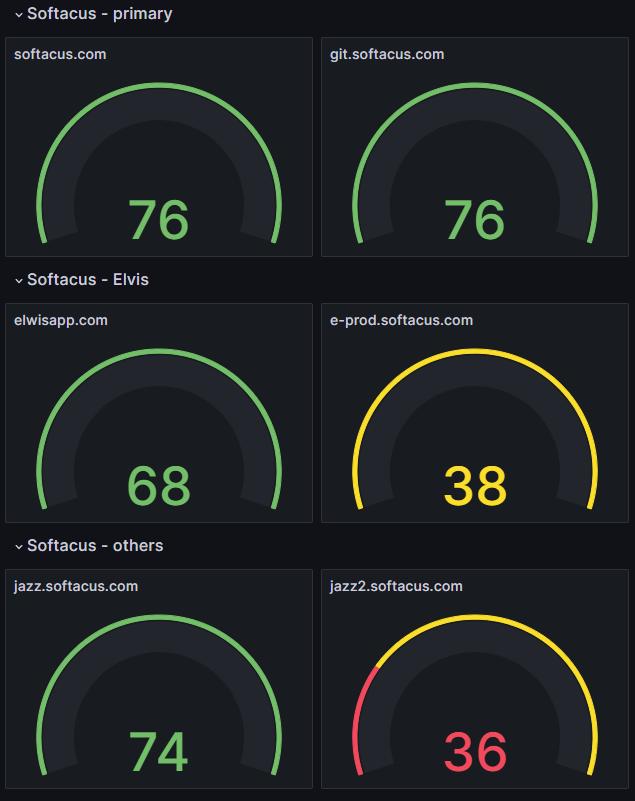
9.) Monitoring of SSL Certificates
Effortless Integration and Your Efficient Journey
Our solution effortlessly integrates into various environments. The setup is meticulously planned to ensure a smooth integration, enabling you to harness proactive monitoring for your IBM ELM applications. If you're all set to boost your efficiency through monitoring, reach out to us at info@softacus.com, and your journey to success begins right here with Softacus
Monitoring Solution - Accessing Logs
When it comes to the monitoring solution of accessing logs, the biggest advantage by far is the fact, that it allows people, who are unable to access the server, to view and send the logs to IBM for troubleshooting. This is recognizable as a high-impact positive change for many customers, because ELM application managers have a need for the logs but as of now, the only ones with access to them are infrastructure managers.
Other Benefits:
- Logs can be accessed even if the upstream server is offline, compromised or out of commission.
- Data can be analyzed and correlated in multiple systems.
- When a server is attacked by an attacker, it is more difficult to delete the evidence left behind.
- Investigation and control of incidents is easier because all logs are in one place
- Easier to search in logs, e.g. by bug count
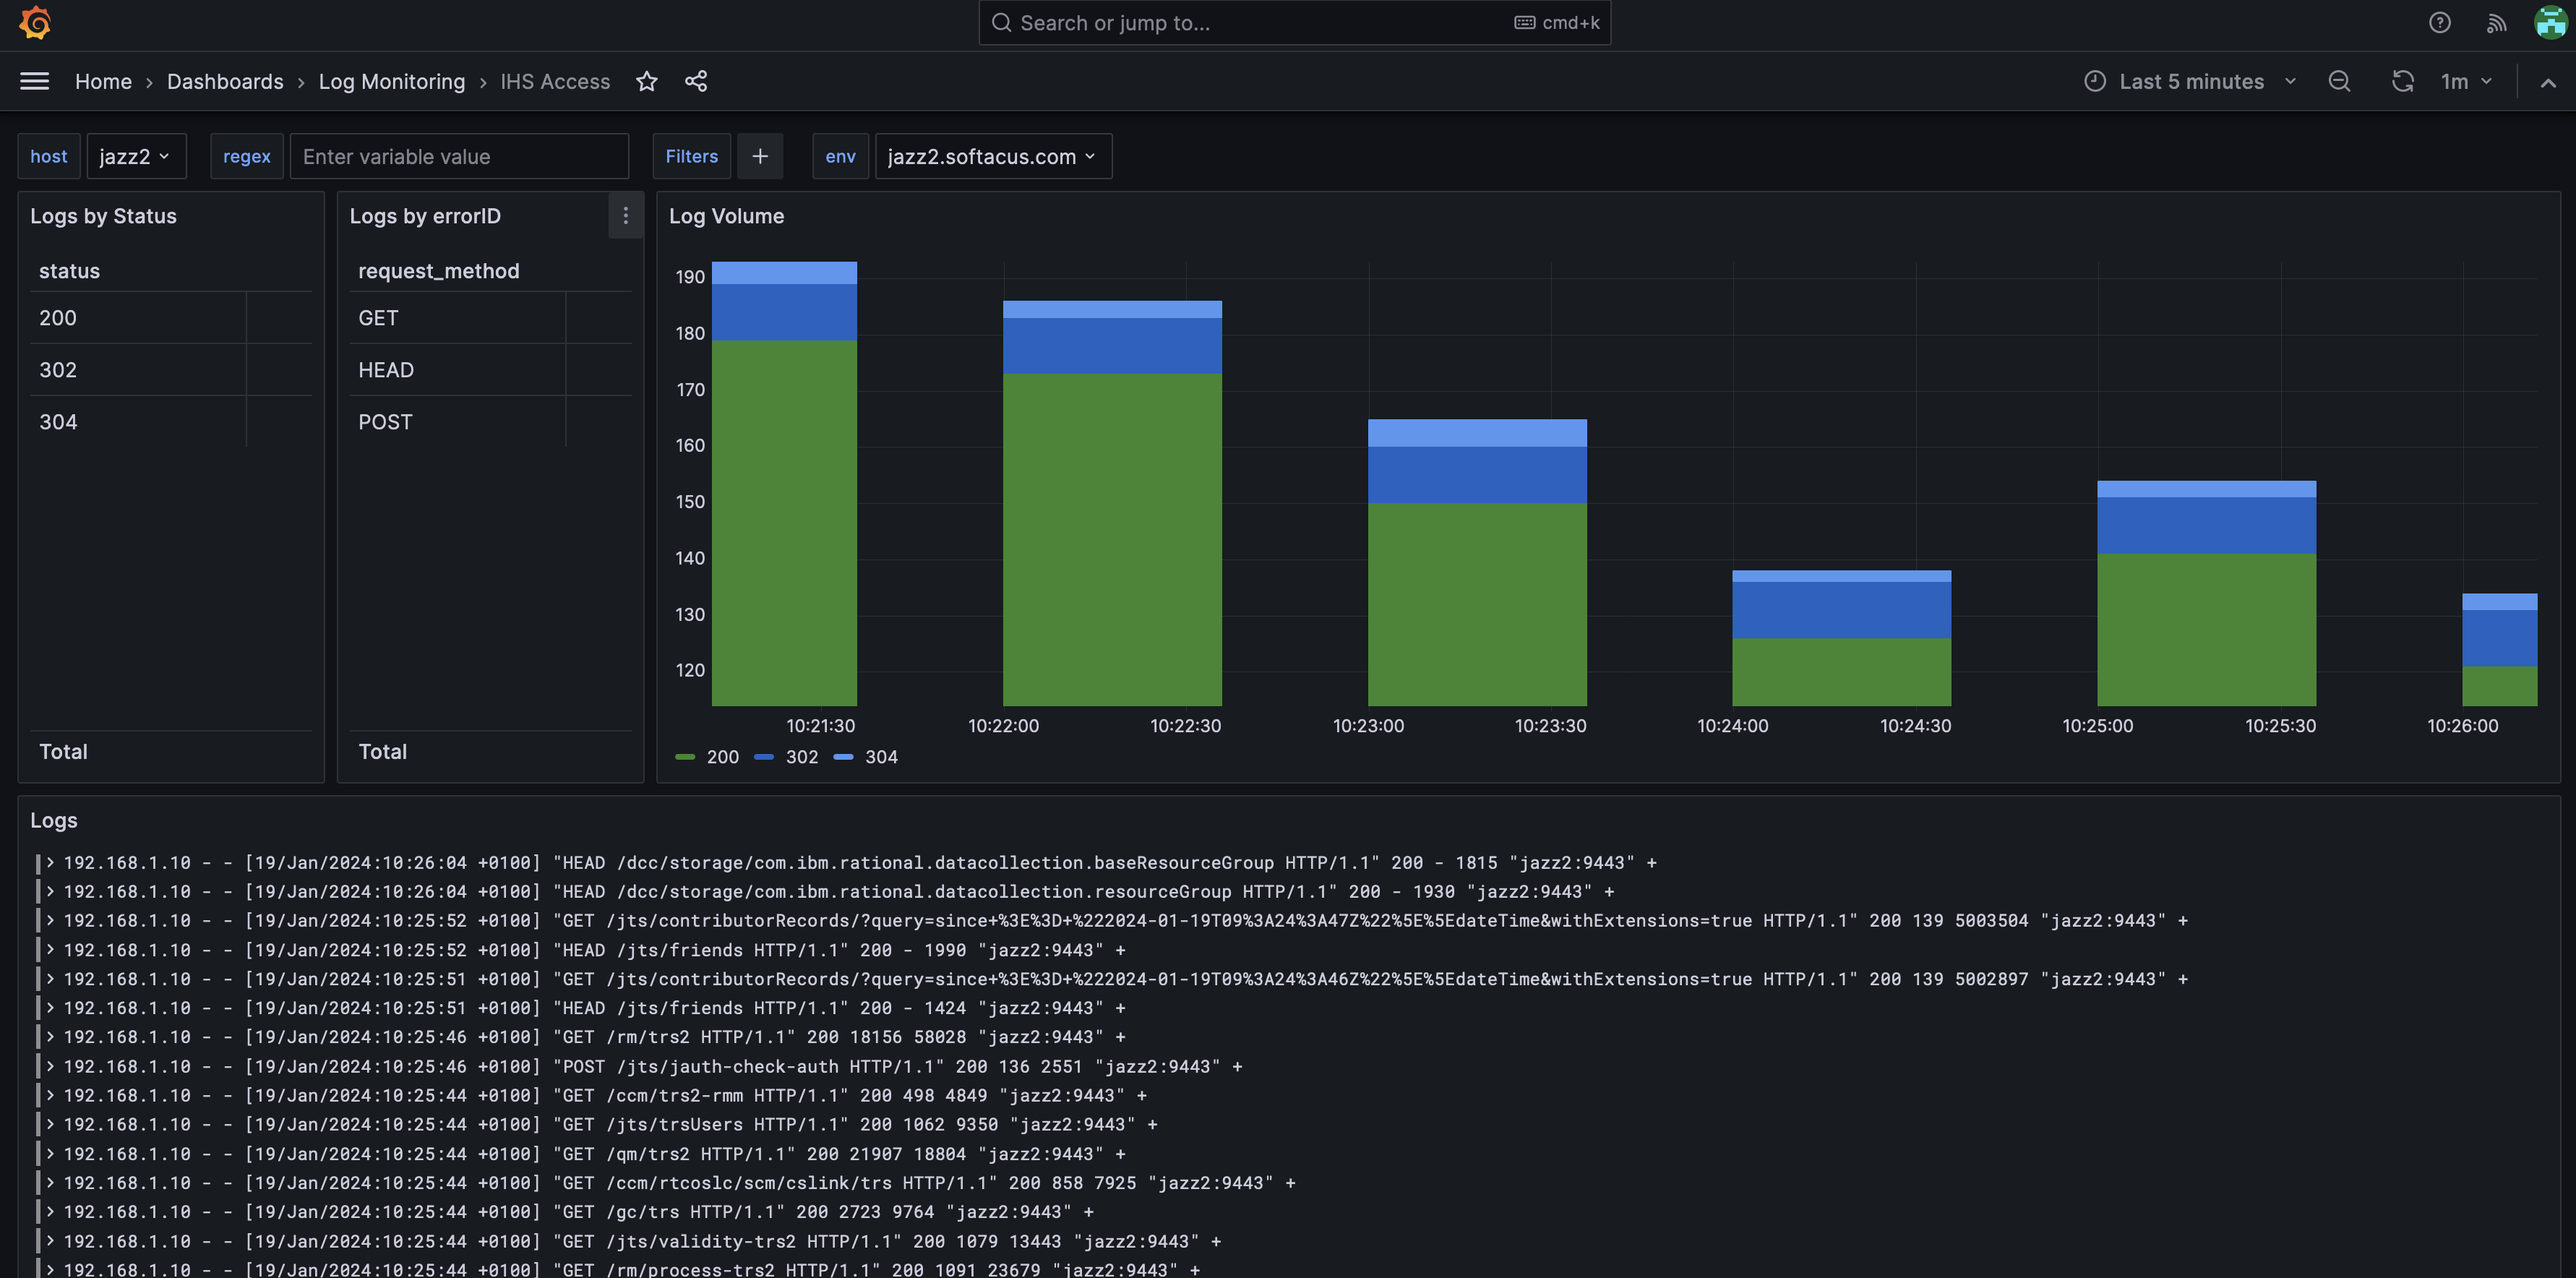
10.) Log Monitoring - IHF Access
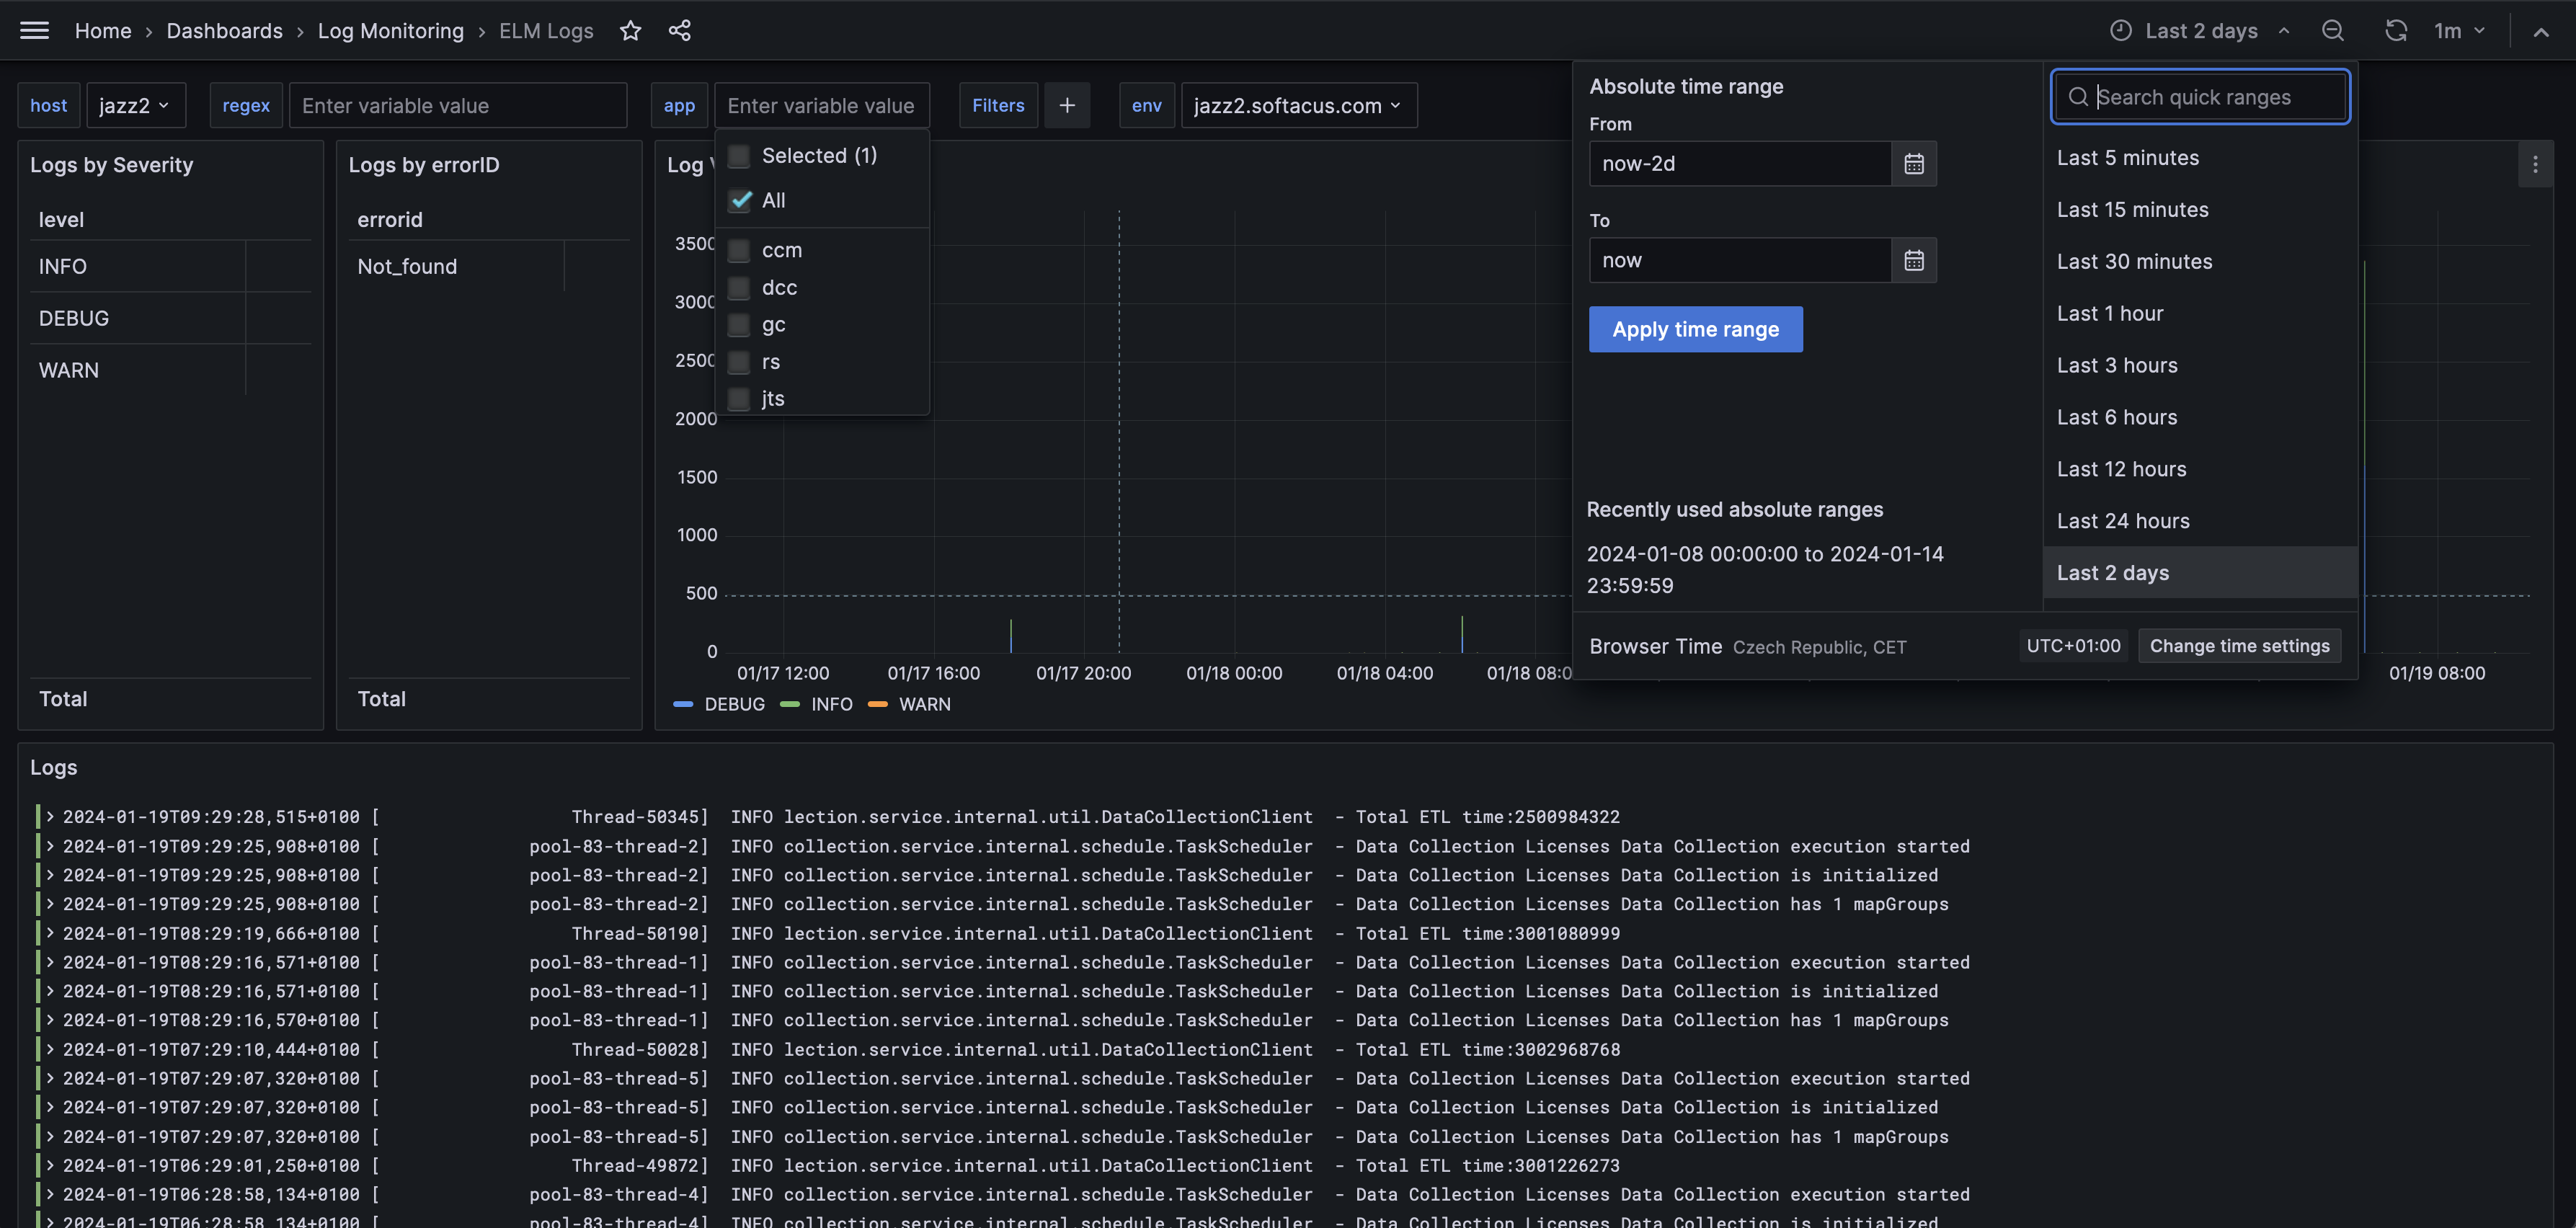
11.) Log Monitoring - ELM Logs
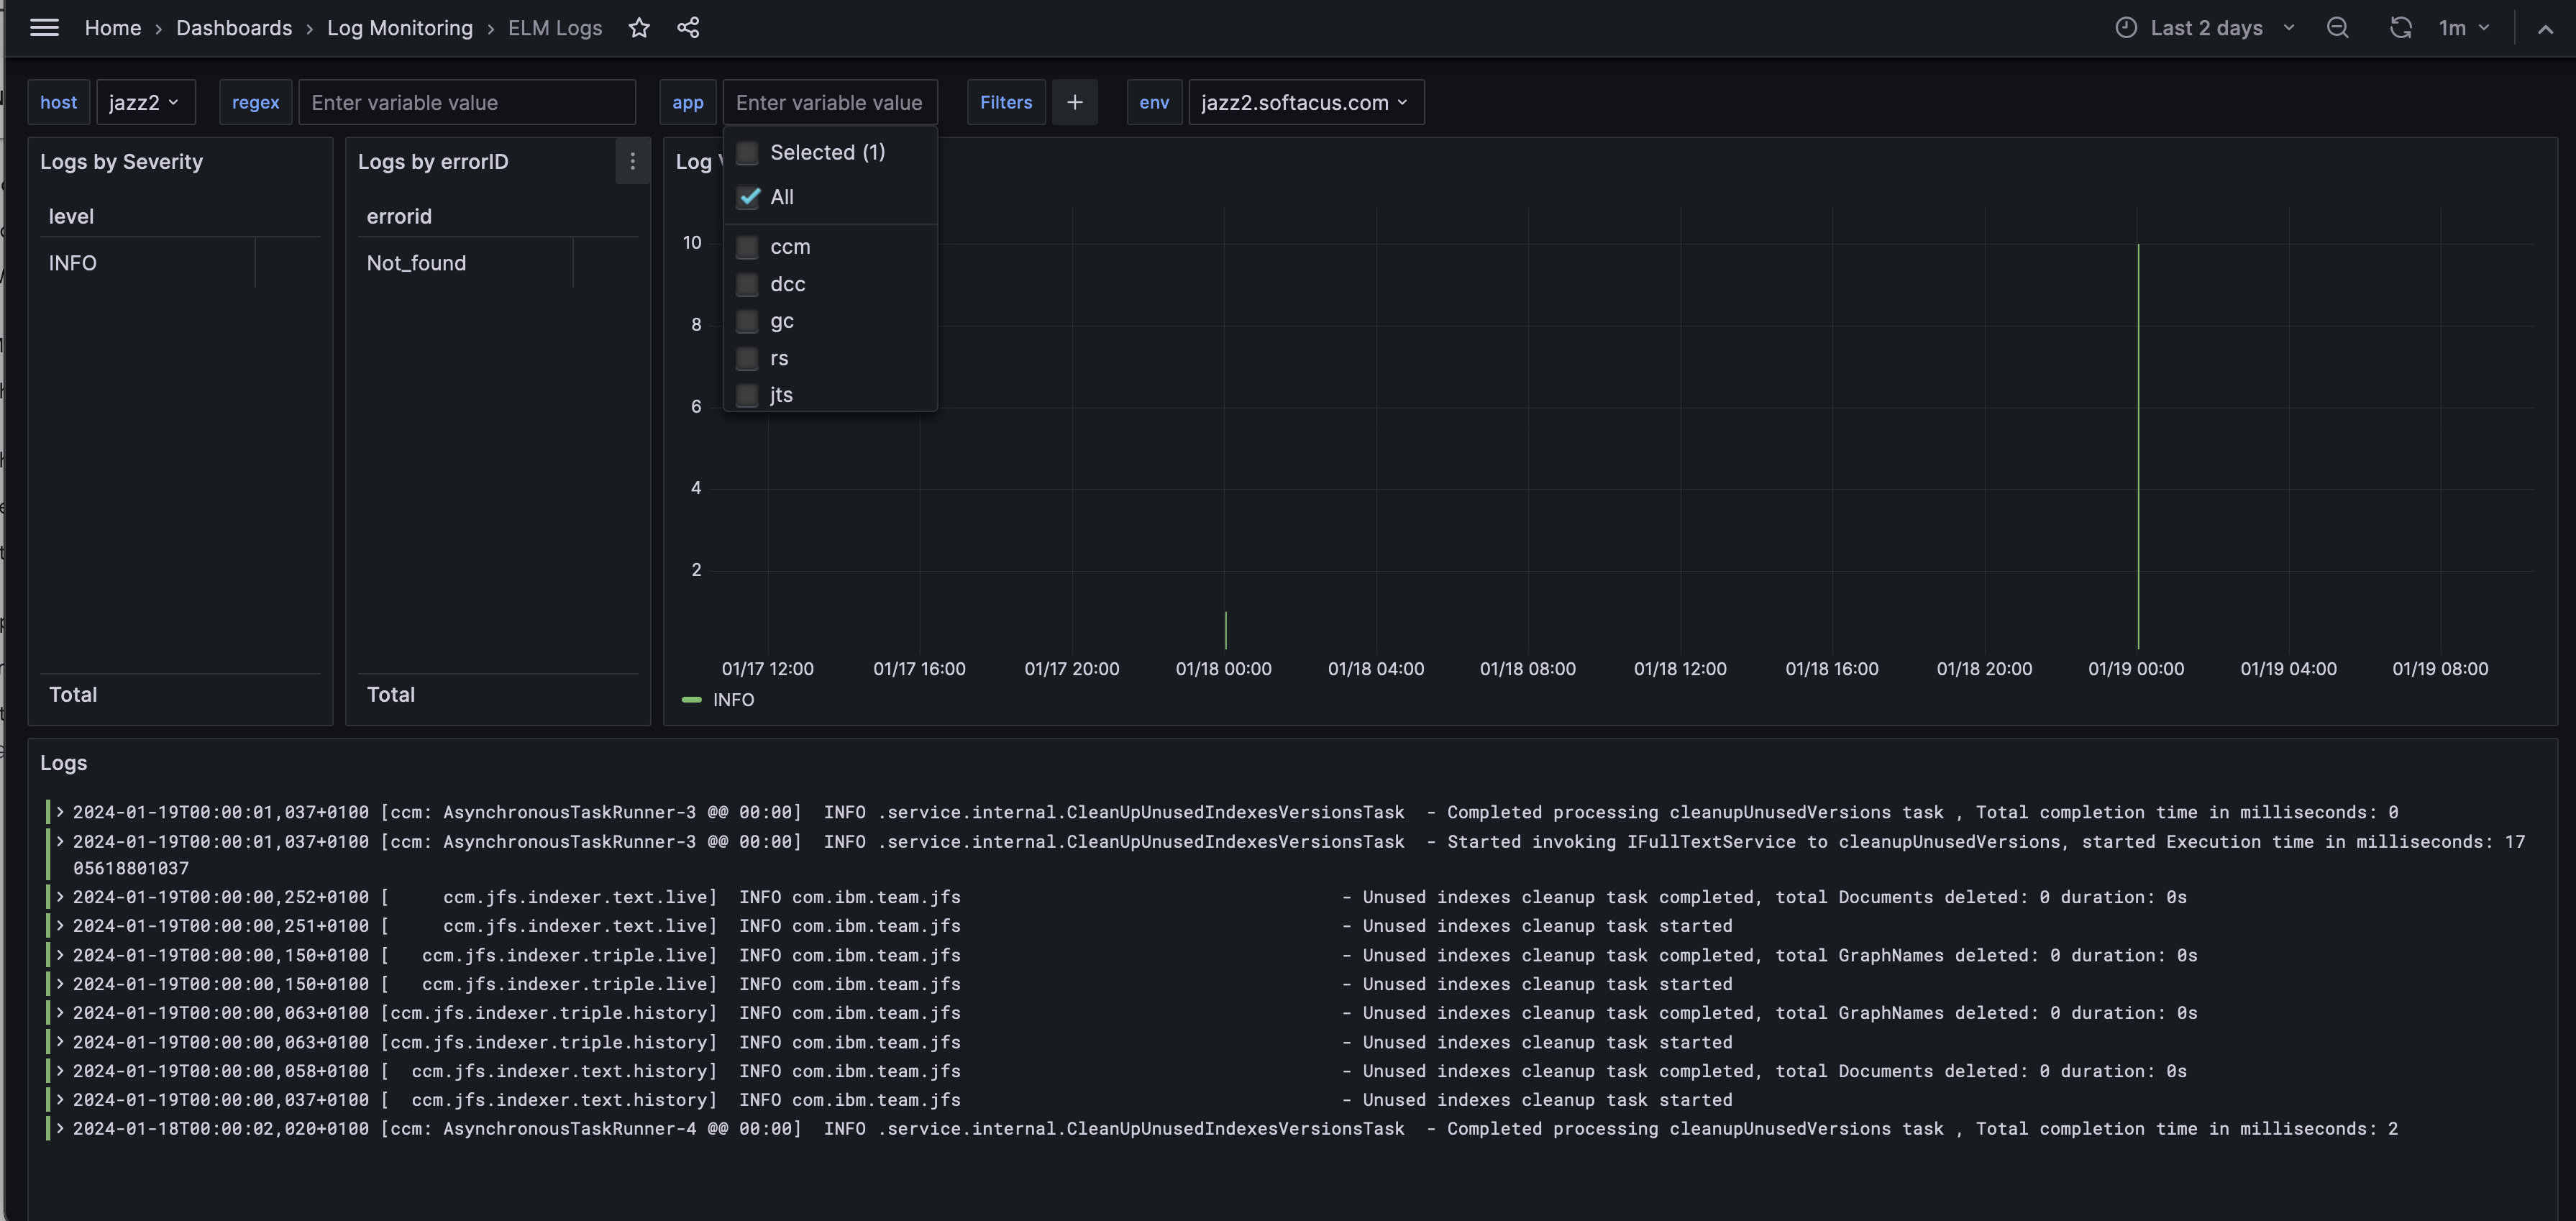
12.) Logs Filtering - Severity & Error ID
Softacus Services
We, in Softacus, are experts when it comes to consulting and service delivery of IBM software products and solutions in your business. We help our clients to improve visibility and transparency when licensing and managing commercial software, providing measurable value while increasing efficiency and accountability and we are providing services in different areas (see Softacus Services).
IBM ELM extensions developed by Softacus are free of charge for the customers who ordered IBM ELM licenses via Softacus or for the customers who ordered any of our services. If you are interested in any of our IBM ELM extensions, you found a bug or you have any enhancement request, please let us know at info@softacus.com.
