Introduction
The use of any applications and systems requires monitoring currently. Monitoring collects various required metrics about the servers and applications in use. Thanks to monitoring, it is possible to detect the threshold values of the monitored metrics, which allows you to react quickly to the non-standard behaviour of the system (outages, etc.). There are several approaches to monitoring, such as using monitoring software or built-in functions and calls of IBM ELM applications. An important part of monitoring is the visualization of monitored metrics, which are displayed in the form of graphs for better interpretation. In addition to the visualization itself, monitoring has the task of monitoring the values of the metrics in real time. In contrast, in the case of exceeding the defined limit values, reports are generated, and service functions are triggered. The system administrator is subsequently notified (system dashboard, email, push notification) of the generated reports, based on which manual problem-solving can begin. The advanced functions of modern monitoring also include automated problem-solving by the software itself reacting to the problems that have arisen.
Overview
IBM ELM applications directly provide, using REST API calls, the possibility of obtaining metric values and information about their status. For basic work with the REST API and quick verification of the correctness of the obtained results, the Postman tool can be used. If there is a need to monitor Java services (JMX processes), these services can be identified using an MBean (an object representing a managed resource/functionality). But this option requires enabling the following "properties" in the system settings of the JTS application, which is shown in the following image.
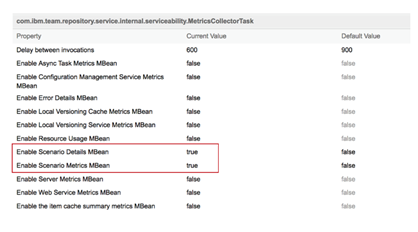
1.) Enabling advanced properties
Subsequently, by entering specific URLs, it is possible to perform queries on the monitored parts of the applications. Another option for obtaining metrics and extending JMX monitoring is to use OSLC calls. The MBean and OSLC define the format of URLs identifying monitored resources.
For obtaining data provided by the REST API (HTTPS protocol), it is possible to use the system tool cURL, the Postman tool, but also any programming language (Python - Requests library). It is convenient to store the obtained data in the local system for later analysis. It is possible to use existing tools (Zabbix) for analysis, or it is possible, in the selected programming language, to implement your solution, either for the detection of non-standard behaviour or data visualization. The standard method for detecting non-standard behaviour is the use of machine learning, which allows the use of models to predict and classify problems.
Preferred Solutions
The most suitable approach for monitoring is the use of a system based on the client/server architecture, where the client part is installed as an agent on the monitored device, from which it reads data and sends it to the server part. An example of such software is Zabbix. Detailed monitoring based on HTTP data transfer can also be performed with the Prometheus software. Monitored metrics are defined using templates. For the visualization of the collected data, it is possible to use the directly mentioned tools (suitable for administrators), but for the end client it is more appropriate to use the Grafana tool for data visualization, which can receive data from the Zabbix and Prometheus tools.
Grafana is a universal data visualization tool. Its deployment requires defining a data source (Zabbix, Prometheus, ...). The standard data source is the database system, but the integration of Grafana with other data sources is possible by using plugins. After the resource is defined, it is up to the user/administrator to design the look and feel of the user interface. In addition to the visualization itself, it is also possible to define the threshold values of the monitored metrics, when they are exceeded, a message is generated, which can be used to notify the system administrator.
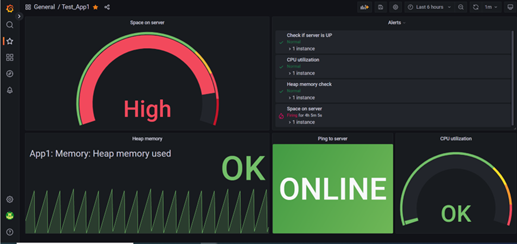
2.) Example of Grafana dashboard
Based on the requirements of the client/target monitored environment, the capabilities and architecture of the monitoring system must be considered. Zabbix and Prometheus systems have the following differences:
Zabbix | Prometheus | |
|---|---|---|
Installation | Simple | Complex |
Architecture | Server/Agent | Automatic Detection |
Data Storage | External Database | Internal Database |
Environment | Machine-based | Service-based |
At Softacus, we prefer monitoring using Zabbix software primarily because we work mostly with virtual machines, where our goal is to monitor the entire machine. If necessary, however, it is possible to extend the functionality of the Zabbix system by monitoring specific applications. This extension can be implemented by using templates (you can use macros) directly on the Zabbix server or by using external scripts that can be run by Zabbix agents on target systems. External scripts can also be run directly from the Zabbix server.
Data visualization is possible using dashboards. The following figures show the custom layout of graphic elements.
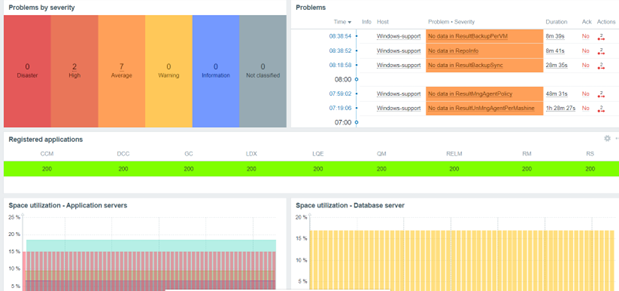
3.) Monitoring of state of the registered applications
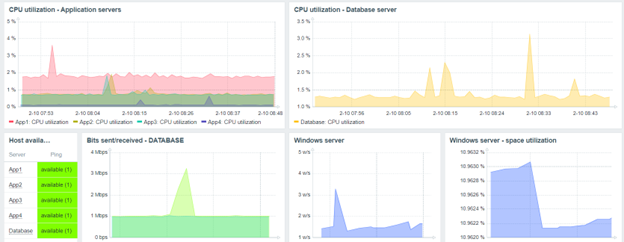
4.) Monitoring of main statistical information of servers utilization
In the previous picture, it is possible to see the monitored values of "CPU and space utilization". Monitored events can be assigned a severity level. The following list shows the existing severity levels, according to their severity level:
- Disaster (highest priority)
- High
- Average
- Warning
- Information (lowest priority)
- If the priority is not classified, it is possible to use the tag - "Not classified".
Specialized Solutions, Approaches and Tips
Our effort is to optimize the process of monitoring applications on the server, which is possible by analysing the environment and finding the most important metrics. This approach, for example, allowed us to extend the monitoring of registered applications in JTS and the expiration of licenses of services implemented at the customer.
The status of registered applications can also be checked manually, using the following procedure:
- Log in to the admin interface
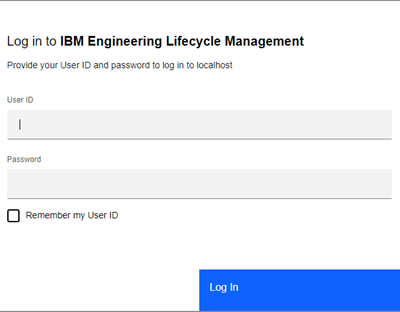
5.) IBM ELM Log in screen
- Go to the Server tab
- Search for the Registered Application tab
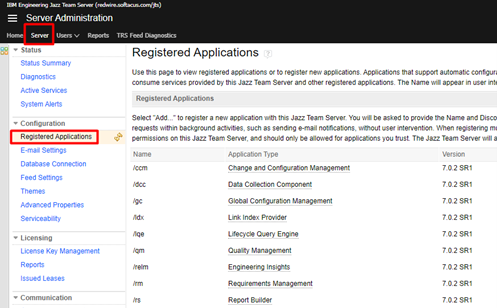
6.) Registered applications view
Registered applications are listed in a table that contains information about the name, application type, version, URL address and their status.
However, the mentioned manual procedure is lengthy and impractical for many applications. A more appropriate approach is to review applications using a programmatic approach that can be automated, saving a lot of time. The procedure for implementing automated application monitoring is as follows:
- Defining the URL address: https://localhost:9443/jts/auth/j_security_check
- Creating a payload for sending authentication data. For example, for the Admin user with the password PASS, it is possible to create a payload in the following form: ['j_username=Admin&j_password=PASS']
- After sending the POST request, Cookies are part of the response, which must be inserted into the headers to enable the following communication.
- Verification of connected applications is possible using a GET request to the URL address: https://localhost:9443/jts/friends
- The GET request returns an XML code in which you need to search for the section that contains the URL address for individual registered applications.
- Verification of whether the registered application is active is realized using an HTTPS request and verification of the return value of the response. The status code for active applications is 200 and for unavailable applications, the status code is 400 or 500. The following figure shows the response to a GET request for an unavailable application.
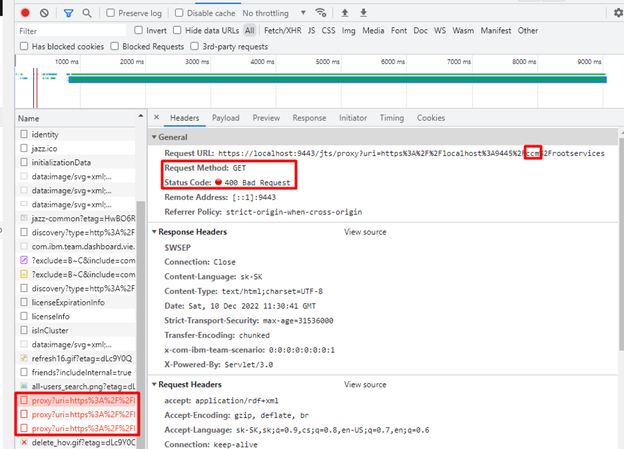
7.) GET Request response for unavailable application
If the registered application becomes unavailable, the defined trigger notifies the system administrator about this event.
Summary
By monitoring, it is possible to facilitate and speed up work in client infrastructures, as well as to speed up the reaction to problems that arise. Monitoring also enables the detection of non-standard situations or their prediction.
Softacus Services
We, in Softacus, are experts when it comes to consulting and service delivery of IBM software products and solutions in your business. We help our clients to improve visibility and transparency when licensing and managing commercial software, providing measurable value while increasing efficiency and accountability and we are providing services in different areas (see Softacus Services).
IBM ELM extensions developed by Softacus are free of charge for the customers who ordered IBM ELM licenses via Softacus or for the customers who ordered any of our services. If you are interested in any of our IBM ELM extensions, you found a bug or you have any enhancement request, please let us know at info@softacus.com.
Related and Referenced Topics
Blog Articles:
Monitoring of Infrastructure and IBM ELM - learn more information about monitoring options for your IBM ELM applications and infrastructure.
Monitoring of IBM ELM - this article aims to provide you information about monitoring capabilities of IBM ELM applications.
